
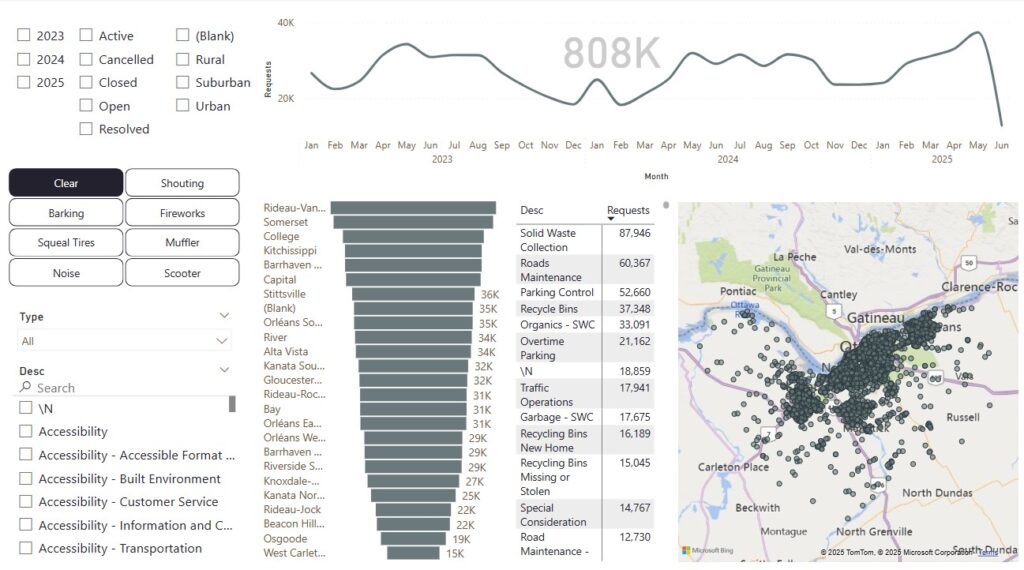
This course uses the Ottawa Open Data project to create a 311 Service Dashboard. In this course you will work with real data. You’ll learn about best practices including the Kimbal method and dimensional modelling.
In this course you’ll learn to answer interesting questions like which neighborhoods have the most noise? Where are the most potholes reported?
Send prefered dates and group size to hello@generalBI.com.
Prerequisites
Any Power BI Desktop Introduction or Power BI Introduction.
Course Content
- Binding reports to Web pages and folders.
- Cleaning data, identifying data inconsistencies and creating Power Query steps to correct them.
- Implementing a relative path for data sources.
- Append and Merge Data
- Surrogate Keys
- Kimbal Methodology, Star Schema, Dimensional Modeling.
- Data Normalization
- Time Intelligence, Date Tables, Calculated Columns.
- Measures, Calculated Columns, DAX (Data Analysis Expressions).
Send prefered dates and group size to hello@generalBI.com.
Course Setup Checklist
- Power BI Desktop:
- Work computers: Install via your software center or contact your help desk.
- Personal computers: A free download link will be provided upon registration.
- Computer with at least two monitors and a mouse.
- The course files (download link provided when you register).